Can a Rental Property Help Fund Your Retirement?
How current rent, market rent and property growth change the picture
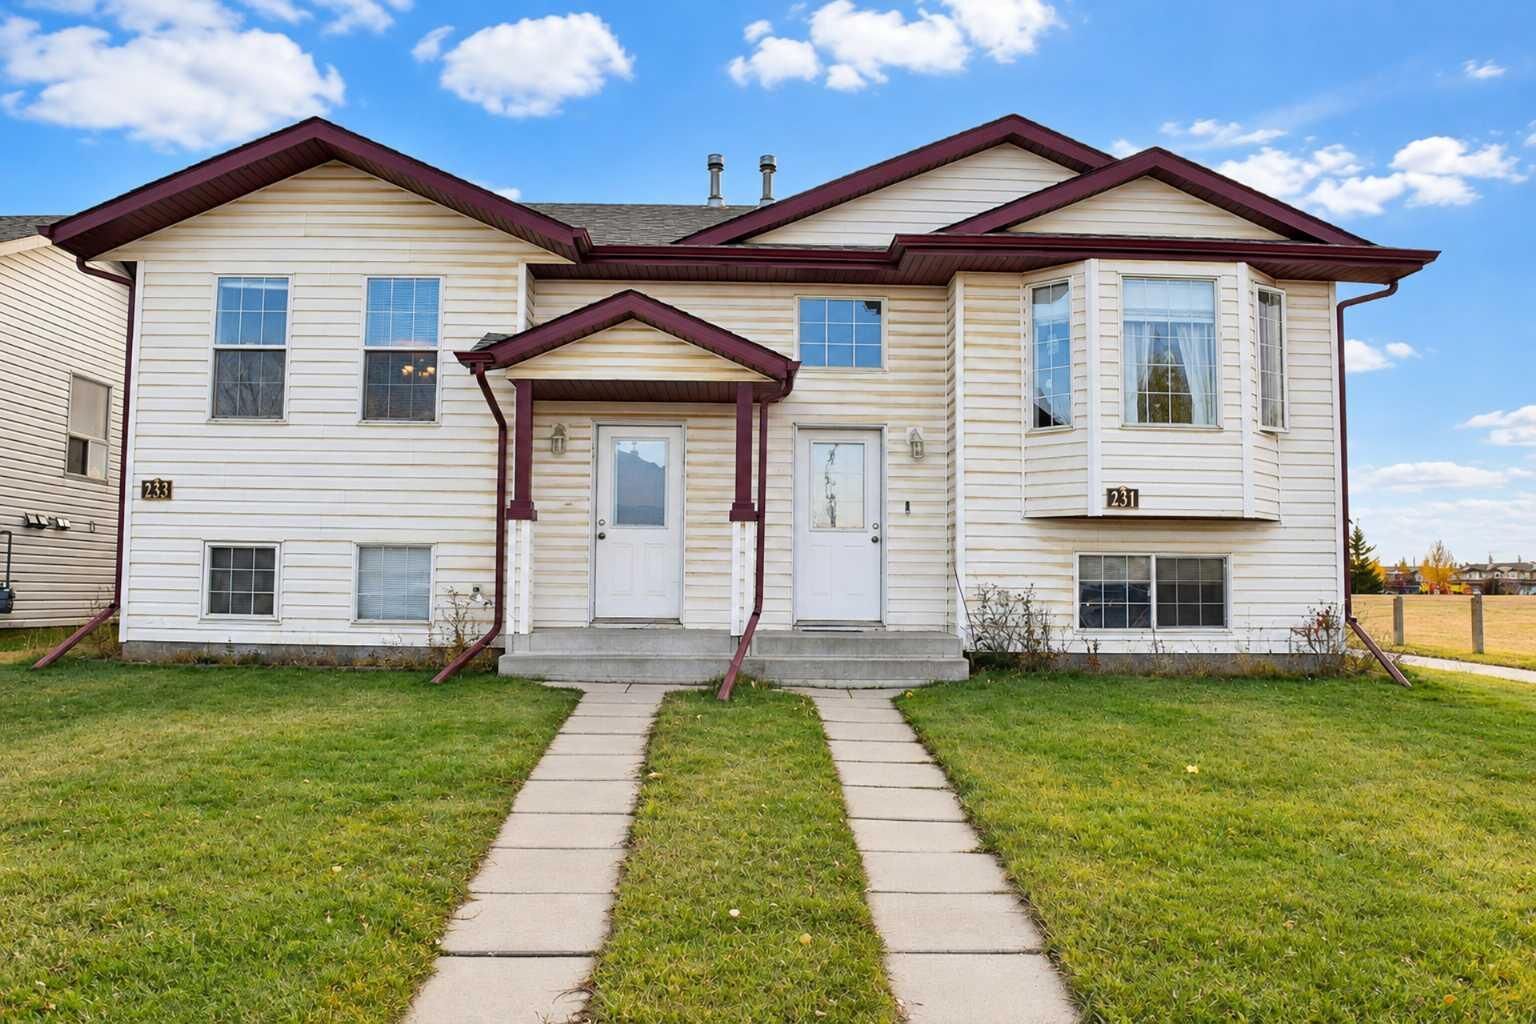
231 & 233 Kendrew Drive, Red Deer. View the property listing.
Yes. A rental property can help fund retirement through rental income, mortgage repayment and changes in property value. It may provide income as the debt falls, or sale proceeds later. The useful question is what you need to contribute along the way and what you might receive in return.
That is why an investment property deserves more than one calculation. Current rent tells us where the property starts. A supported market-rent assumption helps us examine a different income scenario. Property-value growth changes the equity and potential sale proceeds, but it does not pay this month's mortgage.
231 & 233 Kendrew Drive offer a practical example. These separately titled properties have a combined asking price of $639,800 and advertised rents of $1,500 per side, or $3,000 monthly. Existing leases extend into 2027, so a higher-rent scenario is not a claim that a buyer can immediately replace those rents.
Start with two rent levels and two growth assumptions
For this comparison, we use the current advertised rent of $1,500 per side and an illustrative market-rent starting point of $1,900 per side. The higher figure is a scenario informed by advertised comparables, not a confirmed achievable rent or a rent increase for the existing tenants. Condition, layout, utilities, parking and lease terms all matter.
We then apply 2% and 3% annual rent growth to each starting point. These are four separate paths. Year 1 means the first year of that hypothetical rent level, not a dated forecast of the existing leases. Growth starts in Year 2; the timing of any actual change must be assessed separately.
All four paths use the same financing: 25% down, a hypothetical 5% mortgage rate and a 25-year amortization. The payment is approximately $2,791 monthly. Property taxes and insurance rise by 2% annually in every case. Vacancy, management, maintenance and capital allowances remain in the calculation and their dollar amounts follow rent.
| Starting rent / annual rent growth | Year 1 | Year 10 | Year 20 |
|---|---|---|---|
| Current $1,500 / side + 2% | −$1,138 | −$816 | −$383 |
| Current $1,500 / side + 3% | −$1,138 | −$561 | +$306 |
| Market $1,900 / side + 2% | −$519 | −$76 | +$519 |
| Market $1,900 / side + 3% | −$519 | +$247 | +$1,391 |
Market rent is hypothetical. Negative figures are owner contributions. Monthly amounts are annual cash flow ÷ 12, rounded to the nearest dollar. The annual Year 20 results are −$4,600, +$3,667, +$6,225 and +$16,696 respectively.
At the current starting rent with 2% annual growth, the model still needs about $383 a month from the owner in Year 20. At a $1,900 starting rent with the same 2% growth, it instead produces about $519 a month. Using 3% rent growth raises that hypothetical market-rent result to about $1,391 a month.
Those changes are meaningful. The point is to test supported alternatives, not assume the highest rent or growth rate will occur.
Then test three property-value paths
Rent growth and property-value growth are separate assumptions. We test flat prices, 2% annual value growth, and a historical-growth reference of approximately 2.2%.
The historical reference uses the property's documented 2015 transaction basis and the midpoint of a September 2026 working valuation range. It is an estimated price-growth rate, not a realized investment return, a new appraisal or a forecast. It has not been adjusted for improvements made during ownership. Here, the historical reference is close to the 2% scenario, so those two projections are similar.
For consistency, the forward examples start from the $639,800 asking price. That is an illustrative purchase and initial-value assumption, not a guarantee of market value. Each rent path is paired with each value path, giving 12 combinations rather than one preferred answer.
| Annual property-value growth | Year 10 | Year 20 |
|---|---|---|
| Flat / 0% | $639,800 | $639,800 |
| 2% | $779,913 | $950,709 |
| Historical proxy / 2.23% | $797,579 | $994,267 |
Even with flat prices, mortgage repayment builds equity. The modeled loan falls from $479,850 to about $354,111 after 10 years and $148,072 after 20, assuming the same rate throughout. Appreciation, when it occurs, adds to that equity. It can also be negative; flat prices are not a worst-case scenario.
Count the contributions before calling it profit
Gross equity is the property's value less the remaining mortgage. It includes your down payment and is not all profit. Selling costs and every later cash contribution must also be counted.
For example, with 2% annual rent growth and 2% annual value growth, the current-rent case produces an estimated pre-tax sale profit of about $96,000 after 10 years and $394,000 after 20. Starting instead at the hypothetical $1,900-per-side rent raises those estimates to about $178,000 and $575,000.
Those figures include modeled purchase and sale costs, mortgage repayment and operating cash flows. They do not count principal repayment twice, and positive cash distributions are not assumed to earn an additional return. The accompanying comparison shows all 12 outcomes, owner contributions and annualized returns.
See all 12 modeled sale-return comparisons
Current starts at $1,500 per side; market starts at a hypothetical $1,900. Each sale horizon is a separate holding-period example. Profit is after all modeled contributions and costs, before tax.
| Rent / growth | Value growth | 10-year profit / IRR | 20-year profit / IRR |
|---|---|---|---|
| Current / 2% | Flat | −$36,803 -1.72% IRR | $99,033 1.56% IRR |
| Current / 2% | 2% | $96,304 3.62% IRR | $394,397 4.69% IRR |
| Current / 2% | Hist. 2.23% | $113,087 4.15% IRR | $435,777 5.02% IRR |
| Current / 3% | Flat | −$22,476 -1.04% IRR | $170,727 2.62% IRR |
| Current / 3% | 2% | $110,631 4.13% IRR | $466,091 5.45% IRR |
| Current / 3% | Hist. 2.23% | $127,414 4.65% IRR | $507,471 5.76% IRR |
| Market / 2% | Flat | $44,558 2.10% IRR | $279,572 4.52% IRR |
| Market / 2% | 2% | $177,665 6.77% IRR | $574,936 7.09% IRR |
| Market / 2% | Hist. 2.23% | $194,448 7.25% IRR | $616,316 7.38% IRR |
| Market / 3% | Flat | $62,705 2.91% IRR | $370,385 5.78% IRR |
| Market / 3% | 2% | $195,812 7.40% IRR | $665,749 8.05% IRR |
| Market / 3% | Hist. 2.23% | $212,595 7.86% IRR | $707,128 8.30% IRR |
Annual IRR is a money-weighted return using initial cash at Year 0, operating cash at each year end and sale proceeds at the final year end. Positive cash distributions are not reinvested. These estimates exclude income and disposal taxes.
Annual cash flow is another measure. A year's mortgage principal repayment and change in property value may increase wealth, but neither is spendable rental income. We keep those components separate rather than describing all of them as annual cash profit.
Choose the role before choosing the property
Are you looking for income today, equity during your working years, or potential retirement income later? The answer affects the purchase price, financing and cash commitment that fit your plan.
The 25%-down example is not immediately cash-flow positive at either starting rent used here. A shorter amortization requires more money initially but can clear the mortgage sooner. More down payment also changes cash flow, while tying up more capital. No one structure is automatically the best choice.
5101 50 Avenue: a different investment conversation
Our downtown listing at 5101 50 Avenue / 4940 51 Street combines commercial and residential space and is offered at $389,900, as is and subject to existing tenancies. Its rent roll, collections, operating costs, vacant space and building condition need their own review. A lower asking price alone does not establish a better return.
Start with information you can check
Review the leases, confirm collections, obtain financing and insurance quotes, and assess maintenance and capital needs. Then test vacancy, repairs and renewal rates before deciding whether the required contributions and potential returns fit your retirement plans.
If you are considering your first rental property or adding to a portfolio, let's take a closer look at the property, the assumptions and the numbers behind it.
Patrick Galesloot
Broker/Owner | CENTURY 21 Advantage
Call 403-357-9142 Email Patrick
About the examples
All figures are illustrative, in Canadian dollars, nominal and before tax. The base model uses 25% down, 5% nominal mortgage interest with semiannual compounding and monthly payments over 25 years, annual property taxes of $5,033 and estimated insurance of $3,000. Vacancy is 5% of gross rent; management is 8% of collected rent; maintenance and capital allowances are each 5% of gross rent. Capital allowances are treated as spent, not returned on sale. Purchase costs are estimated at 2% and sale costs at 5%. The mortgage rate stays constant only for modeling, not as a prediction of renewal rates. Taxes on income and disposal, extraordinary costs, investor time and inflation are not modeled. Actual rents, costs, financing and values may differ. The comparisons do not establish that an existing tenancy can be repriced or that a particular rent will be achieved.
Asking-rent examples reviewed October 21, 2026: 259 Kendrew Drive ($1,900 plus utilities; availability not independently confirmed), Kyte Crescent Townhomes (from $1,839) and Kitson Close Townhomes (from $1,989). Manager prices are net of advertised incentives on a 12-month lease, with parking extra. These are asking advertisements, not completed rental transactions, and the properties are not identical.
Historical price-growth method: combined documented 2015 transaction basis to the $625,000 midpoint of a September 28, 2026 working value range of $620,000–$630,000, subject to walkthrough. Using the July 8, 2015 transfer-registration date gives 2.2287% annual nominal price growth, rounded to 2.23% in the tables. It is not adjusted for improvements and is not an investment return or forecast.